
Tools by Lalit A Patel
|
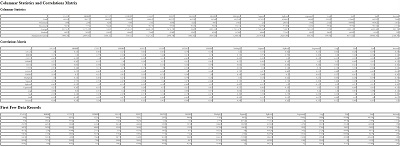
Statistics and Correlation Matrix of Columns This tool can compute statistics and correlation matrix of columns of your dataset. |
|
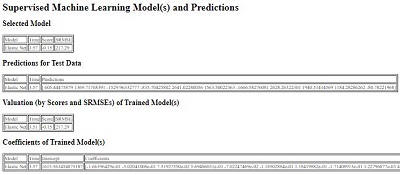
Supervised Mahine Learning Model This tool allows you to build a supervised machine learning model from your training dataset and then make predictions for your test dataset. |

|
Image Classification This tool allows you to classify your image into a class if the image is of a pre-trained type. |

|
Object Detection This tool allows you to detect objects in an image if the objects are of pre-trained types.. |
|
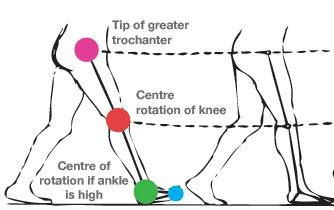
Gait Analysis This tool allows you to analyze walking pattern of a human being. It can be useful to recommend a physical therapy. |
|
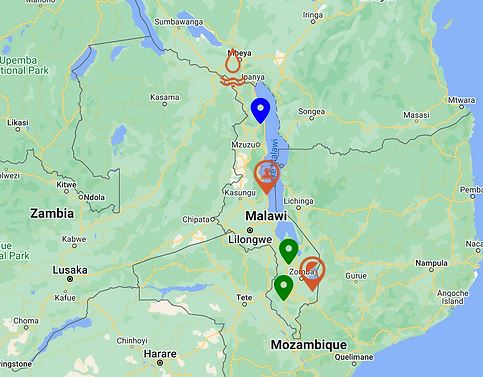
Alerts sMapping This tool allows you to map alerts on a regional map. |
|
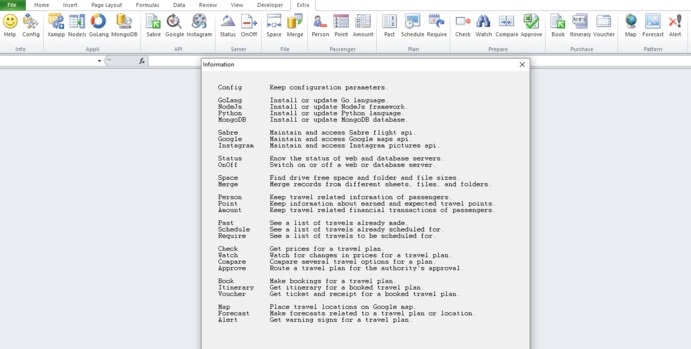
Extra Xlam With Extra.xlam installed as an add-in, Excel menu bar shows ExStream menu with its ribbonbar. Xampp, NodeJs, GoLang, and MongoDB buttons can download and install these tools. Sabre, Google, and Instagram buttons help for these APIs. Status button can show the status of various servers. OnOff button can start or stop a server. Space button can show the sizes of drives, folders, and files. Merge button can merge records from different worksheets, files, and folders. Person, Point, and Amount buttons can prepare and open Excel files for records of passengers, travel points, and travel financials. Check button can make use of a Sabre API and fetch information of flights available for multiple travel plans listed on a spreadsheet. Watch and Compare buttons can monitor and compare travel options. Approve button can route a travel plan for authority’s approval. Book button can book a travel plan. Itinerary and Vouch buttons can get itineraries and vouchers for travel plans. Map button can show locations on Google map, Forecast and Alert buttons can give forecasts and alters related to upcoming travel plans. |
|
TrendMap TrendMap.xlsm is useful for visualizing and understanding various data by regions. The vector map technique used here can be used without subscription fees. Show Trend button produces a color map of USA and colorizes states depending on their monthly fuel sales. Show Friends button computes and compares statistics of the sales data. If a state is clicked, the map shows its highly-correlated (friendly) state. |